

 Over a month ago, Super Micro Computer, Inc. (SMCI) appeared on our StockCharts Technical Rank (SCTR) Top 10 list. SCTRs are an exclusive StockCharts tool that can help you quickly find stocks showing strong technical strength relative to other stocks in a similar category.
Now, the stock market is dynamic, and SMCI, like many stocks, went through a consolidation period with its price trading within a certain range. While SMCI was basically moving sideways, other stocks, such as Palantir Technologies, Inc. (PLTR), Robinhood Markets Inc. (HOOD), and Roblox Corp. (RBLX), took their turn on the Top 10 SCTR list.
Spotting SMCI’s Potential Turnaround
After over a month of this sideways movement, SMCI is starting to show signs of a breakout. This can often be a sign of renewed strength for a stock to move higher, though there’s no guarantee.
A significant factor behind SMCI’s rise is the strength in AI-related tech stocks, which has given the broader market a big boost. The Nasdaq 100 ($NDX) hit record highs, and other major indexes such as the Nasdaq Composite ($COMPQ) and S&P 500 ($SPX) are just a hair away from hitting their record highs. For as long as this positive trend remains in place, SMCI will likely ride higher with the market.
Let’s break down SMCI’s daily chart.
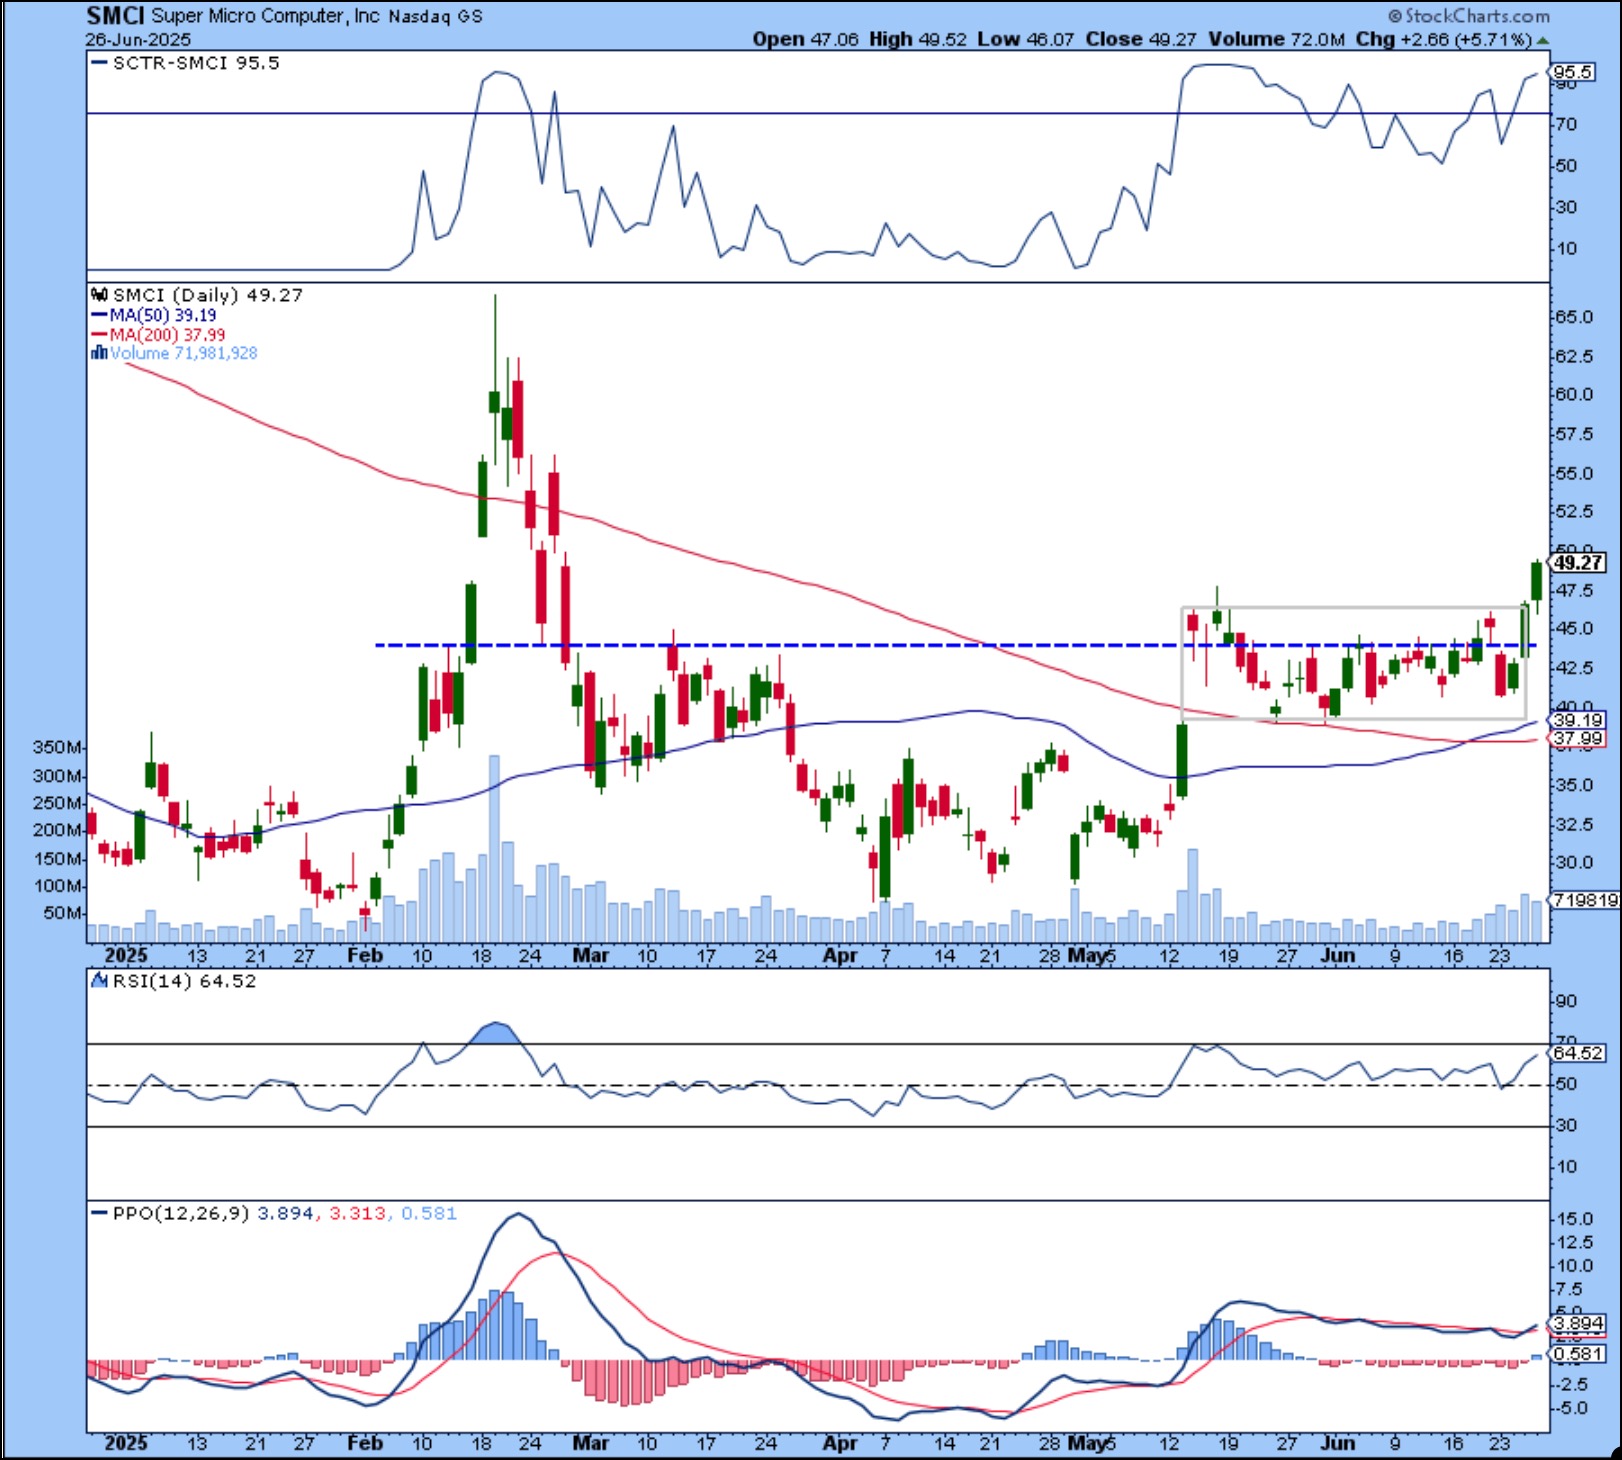
FIGURE 1. DAILY CHART OF SMCI STOCK. SMCI broke out of a trading range and has the potential to rise higher if momentum strengthens. Monitor momentum indicators such as the RSI and PPO.Chart source: StockCharts.com. For educational purposes.
SMCI’s SCTR score was at 95.5 after Thursday’s close. The stock is trading comfortably above its 50-day simple moving average, its relative strength index (RSI) is approaching the 70 level, and the percentage price oscillator (PPO) is starting to show encouraging signs of positive momentum (see daily chart below).
Since SMCI has hit a high of $122.90, your initial thought might be that the stock has significant upside potential. It very well could. However, a key part of smart investing is understanding and managing risk. You know very well that any negative news headline is bound to send SMCI tumbling back to its lows; after all, it’s happened before.
Let’s say you spotted this breakout. The ideal approach is to wait for a pullback and a reversal back to the upside with strong follow-through before entering a long position. However, given the stock is moving relatively quickly, you let FOMO get to you and decided to enter a long SMCI position at around $48.
With the stock closing near its high for the day, there is the possibility of a higher move at the open, short of any negative news. But nothing is guaranteed, and you need downside protection for your position. Initially, your stop loss would be the top end of SMCI’s trading range. But what about your upside price targets?
For this, I turned to the weekly chart of SMCI and, using the annotation tool, added Fibonacci retracement levels from the March 2024 high to the November low.
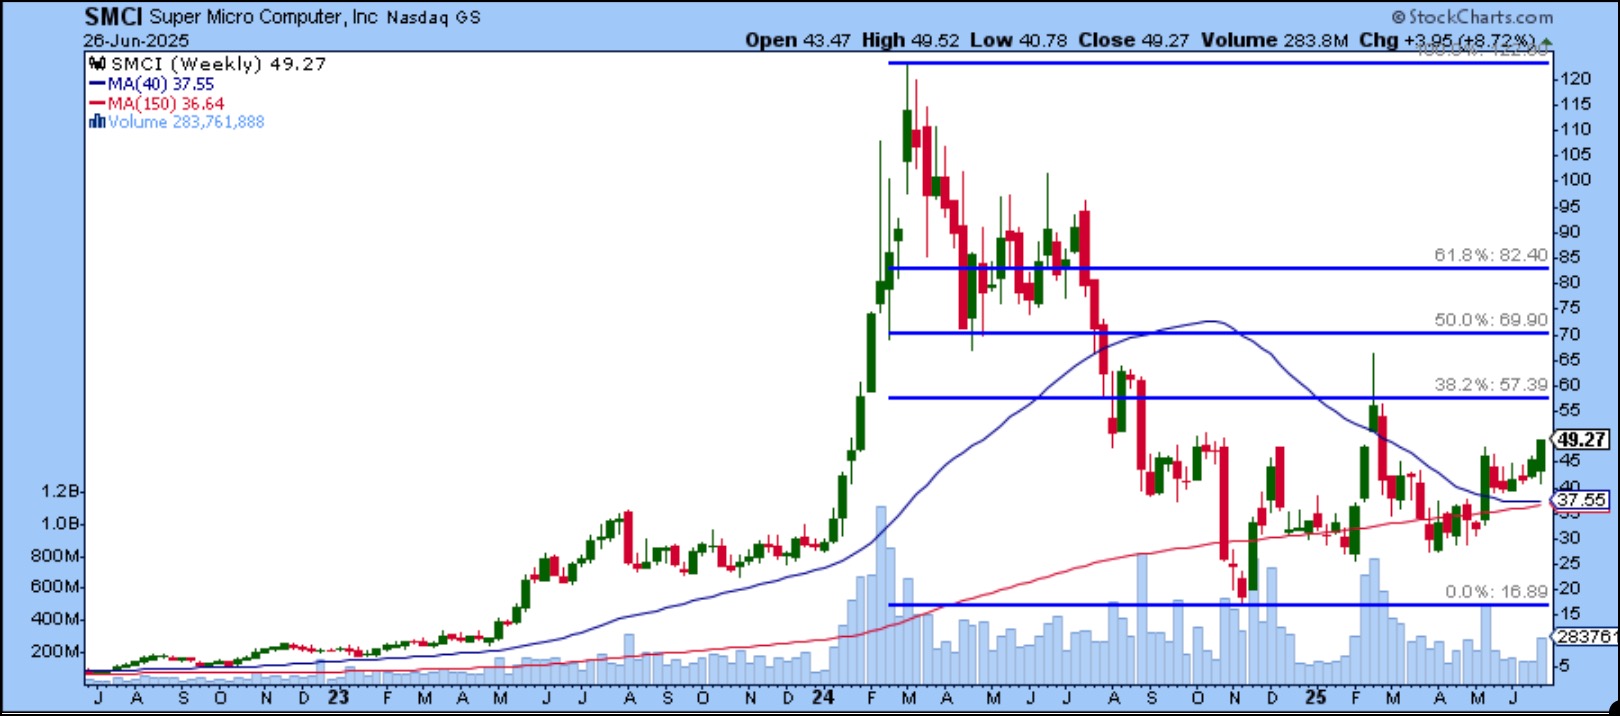
FIGURE 2. WEEKLY CHART OF SMCI STOCK. Annotating Fibonacci retracement levels from the March 2024 high to the November 2024 low is one way to identify price targets.Chart source: StockCharts.com. For educational purposes.
Your first price target could be the 38.2% level, which falls just below $60. This aligns with the February high and was an area where the stock price stalled during August 2024 before it continued lower. If SMCI’s stock price hits that level, don’t be surprised if it wavers here. It could continue higher or fall lower depending on investor sentiment toward AI stocks.
Closing Position
Remember, protecting your capital is of utmost importance, regardless of whether the trade goes in your favor or not. Use stops with discipline, since stocks like SMCI can move both up and down quickly. Your objective should be to keep your losses small and let your profits run until the upside momentum dries up.

Disclaimer: This blog is for educational purposes only and should not be construed as financial advice. The ideas and strategies should never be used without first assessing your own personal and financial situation, or without consulting a financial professional.